Research + Design Advanced Studio

Monoculture Farms
Monoculture farms focus on growing a single crop across large areas. These systems often rely on mechanization and streamlined workflows to maximize yield. While efficient, they can face challenges in soil health, biodiversity, and long-term resilience without rotational or regenerative practices.

Diversified Farms
Diversified farms integrate multiple crops, livestock, composting, or agroforestry systems. This approach supports ecological balance, economic flexibility, and adaptive land use. Diversified models are often more resilient to market shifts and environmental stressors, offering layered productivity across seasons.

Urban Farms
Urban farms operate within city environments—on rooftops, in vacant lots, or through vertical systems. They prioritize local food access, education, and sustainability, often using compact, tech-enabled layouts. Despite limited space, urban farms contribute meaningfully to food systems and community resilience.
Examples: Battery Urban Farm - NYC Urban Farms

Crops:Built:Land
This research offers a flexible framework for analyzing farm economics through spatial quantification and comparative land use modeling. By examining three distinct New York farms: monoculture, diversified, and urban, the research provides a launch point for users to apply the same methodology to their own agricultural settings. Rather than presenting fixed conclusions, the project encourages site-specific exploration of how infrastructure, crop diversity, labor models, and policy support influence productivity and long-term viability. Through this approach, users can contribute to an evolving archive of farm layouts and performance metrics, helping to shape adaptable, resilient models suited to both rural and urban conditions.
DEFINE Farm Typologies
Symbol key


Farmhouse
Systems
Residential
Water
Paths
Forestry
Multi Crop
Single Crop
Click On Each Symbol
The farms
Monoculture Farm | Always Growing Farm
Diversified Farm | Chester Agricultural Center
Urban Farm | Essex Market


Always Growing Farm, operated by Crystal Calabrese in Brooktondale, NY, specializes in growing high-quality garlic. As a vendor at the Ithaca Farmers Market, the farm supports the local food system through sustainable practices, offering fresh produce and fostering strong community connections rooted in care, quality, and environmental responsibility.
The Chester Agricultural Center in Orange County, NY, supports a regenerative and equitable food system by offering affordable land leases, shared infrastructure, and bilingual technical assistance. Home to BIPOC- and women-led farms, it fosters organic, sustainable agriculture while supplying fresh produce to local markets, restaurants, and food-access programs.
Project EATS’ Essex Crossing Urban Farm is a rooftop farm perched atop “The Essex” at 125 Essex Street in NYC’s Lower East Side. Founded by Project EATS, this ¼‑acre organic farm grows carrots, radishes, baby greens, and more. It also hosts educational programs, workforce development, and free senior breakfasts to strengthen community health.


Source: Instagram_Always Growing Farm
Source: Project EATS, Instagram
RESEARCH pROCESS
By using a unified symbol system and scaled grid layout, this research makes it easy to visually compare how each of the three case studies, monoculture, diversified, and urban, utilizes its available land. The consistent metric allows users to see clear distinctions in crop layout, infrastructure density, and land allocation across models. Whether switching between crop types, built structures, or land-use themes, users can explore each farm’s configuration side by side, revealing how different strategies shape productivity, accessibility, and long-term resilience.


Farmhouse
Systems
Residential
Water
Paths
Forestry
Multi Crop
Single Crop
Can we Measure farm patterns?
This infographic introduces a flexible evaluation tool designed to measure farm patterns across varied environments. It breaks down farm operations into six core categories: infrastructure, programming, revenue, performance, longevity, and challenge response. Each category poses a guiding questionto help users assess how different elements contribute to a farm’s success or vulnerability. By using this structure, the tool allows users to compare farms, identify adaptable strategies, and contribute to a growing archive of quantifiable agricultural models.
What types of physical infrastructure are present?
Infrastructure Inventory
What operational programs or practices are in place?
Programmatic Elements
What are the primary sources of income and how diversified are they?
Revenue Breakdown
What indicators reflect the farm’s economic performance?
Performance Metrics
How long has the farm been operating, and what factors support its sustainability?
Longevity Factors
How has the farm’s infrastructure and programming addressed its challenges?
Challenge Response
Click On Each Topic
Graph the patterns
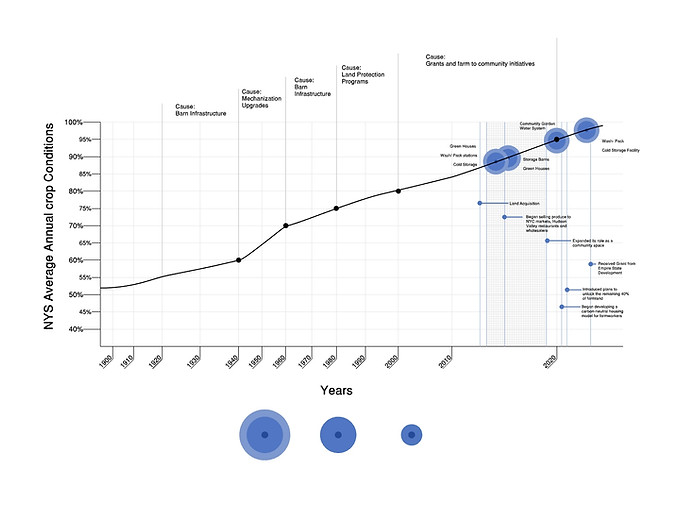
This phase of the research introduces a comparative visual mapping of three distinct farm models, building on earlier quantification of land use, infrastructure density, and crop ratios. Users will explore how crop conditions evolved over time in New York State, influenced by key policy shifts and technological milestones. In the visualization, pink represents the Always Growing Farm, a monoculture-heavy layout focused on yield; blue marks the Chester Agricultural Center, emphasizing regenerative practices and shared infrastructure; and green highlights the Urban Farm at Essex Crossing, showcasing compact, diversified land use in a city setting. Together, these color-coded layouts offer a dynamic lens into how different farms respond to environmental and economic pressures across decades.

Monoculture Farm | Always Growing Farm
Diversified Farm | Chester Agricultural Center
Urban Farm | Essex Crossings


Assessment:
This research highlights a steady rise in crop conditions from 1920 to 1940, driven largely by the introduction of barn infrastructure. Over time, its performance has steadily improved through the adoption of sustainable practices and the support of small farm protection laws. The most significant leap occurred between 2000 and 2020, when sustainability became both a guiding principle and a funding advantage, with farms implementing climate-conscious methods receiving increased grant support and expanded access to markets. Among the case studies, this farm demonstrates the most progressive and consistent improvement across generations.
Sources:
Assessment:
Since 2014, this site has experienced rapid and measurable growth, driven by community-integrated systems that allow farmers to share infrastructure and access long-term leases. Development has been accelerated by targeted grant support, including funding for large-scale wash-and-pack and cold storage facilities. The integration of regenerative practices, equitable land access, and shared resources has enabled small farm operators to scale production efficiently. This case study demonstrates how strategic collaboration and financial investment can transform farmland into a high-performing, inclusive agricultural hub.
Sources:
Assessment:
This site demonstrates how urban agriculture can achieve high productivity despite spatial limitations, with success rates showing consistent seasonal yields across a rooftop footprint of just ¼ acre. Since its launch on July 31, 2023, it has evolved rapidly by leveraging the urban landscape to grow crops while aligning with sustainability practices. As the youngest of the three case studies, its growth highlights the importance of staying current with technological advances—especially in irrigation, soil monitoring, and vertical growing systems—to remain in step with rising NYS average crop conditions. Its trajectory underscores how innovation and policy alignment are essential for urban farms to scale impact and maintain resilience.
Build the ARCHIVE
This research asks whether farm patterns laid across rural, urban, and hybrid models can be measured in a way that supports long-term adaptability. By breaking down each site into quantifiable categories like infrastructure, programming, revenue, and resilience, we create a flexible system that users can apply to their own farms. The goal isn’t just to analyze existing models, but to invite others to contribute data, compare outcomes, and expand a shared archive of land use strategies. This open-ended approach allows for continuous learning and refinement, helping farms evolve in response to changing environmental, economic, and policy conditions.
Swipe Image
collecting farms
We invite you to contribute to our research on farm land use and efficiency by creating your own representation of a farm composition. Using a grid and three simple symbols, circle (crops), triangle (built infrastructure), and square (unused land). Your input will help us collect diverse perspectives on farm planning and contribute to a broader understanding of how different configurations impact agricultural productivity and sustainability.


