Research + Design Advanced Studio
Test These Methods At Home!
Watch these videos to see how you can test methods of creating your own materials out of agricultural byproducts.
Check out our Instagram to see more examples!


Building Byproducts
One of the biggest downfalls of agricultural production is the amount of waste it generates. Agricultural waste can be defined as "residues in a liquid or solid form generated during the production, processing, and marketing of crops and livestock." While most crop residue ends up as waste or, in best case scenario, incorporated into animal feed, there are many possibilities for the use of these byproducts. This is especially true for many of the agricultural products that contains fibrous material such as hulls, husks, straw, stems, pulp, etc. Our interest lies in how byproducts can be used in a residential capacity, both as building materials and to enhance interior spaces. Research has found that many agricultural byproducts can be used as replacement or supplemental material in the creation of concrete, brick, fiberboard, and fabric. In the coming sections, we will discuss some examples of agricultural byproducts that are prevalent around the world, the byproducts that are prevalent in New York State (our area of interest), and how these byproducts can be turned into usable material. You will also see some real world examples of how these methods are being applied today.
To create a circular system, how can farmers use their agricultrual byproducts to enhance their built spaces?
Global Byproducts
All around the world agricultural byproducts are being wasted in the hundreds of millions of tons. This organic material does not have to go to waste. In the following world map you can see examples of where certain agricultural products are heavily produced. Hover over each icon to see what country the agricultural product is being grown in and how much byproduct is being produced.


.jpg)
An estimate 366 million tones of corn are produced each year
An estimated 196 million tons of corn waste is produced each year
UNITED STATES
CHINA
An estimated 269-294 million tons of corn are produced each year
It is estimated that over 737 million tons of corn waste is produced each year
An estimated 104-135 million tons of corn are produced each year
An estimated 62 million tons of corn waste is produced each year
BRAZIL
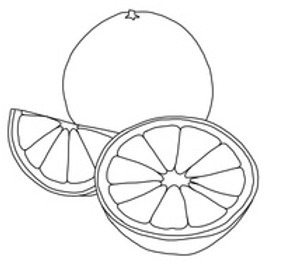
.jpg)
UNITED STATES
An estimated 3.75 million tons of oranges are produced each year
An estimated 3.5-5 million tons of orange waste is produced each year
An estimated 12-15.78 million tons of oranges are produced each year
An estimated 5.4-7.1 million tons of orange waste is produced each year
BRAZIL
EGYPT
An estimated 3.39 million tons of oranges are produced each year
An estimated 339-508 thousand tons of orange waste is produced each year
MEXICO
An estimated 4.53 million tons of oranges are produced each year
The amount of waste created from orange production is not currently available
.jpg)
UNITED STATES
An estimated 51.22 million tons of wheat are produced each year
In the 2024/2025 market year an estimated 75-80 million tons of wheat waste is projected to be produced
CANADA
An estimated 31.73 million tons of wheat are produced each year
An estimated 28 million tons of wheat waste is produced each year
An estimated 78.96-91.5 million tons of wheat are produced each year
The amount of waste created from wheat production is not currently available
RUSSIA
FRANCE
An estimated 37 million tons of wheat is produced each year
An estimated 144 million tons of wheat waste is produced each year
.jpg)
RUSSIA
An estimated 17.8 million tons of potato were produced in 2023
The amount of waste created from potato production is not currently available
UNITED STATES
An estimated 22.5-30 million tons of potato are produced each year
It is estimated that at least 1.4 million tons of waste is created from potato production each year
UKRAINE
An estimated 3-6 million tons of potato is produced each year
The amount of waste produced from potato production is currently unknown
.jpg)
In the 2024/2025 market year, 1.27 million tons of almonds are projected to be produced
An estimated that at least 4 million tons of almond waste is produced each year
UNITED STATES
An estimated 353.7 thousand tons of almonds are produced each year
The amount of waste from almond production is currently unknown
SPAIN
An estimated 112.68 thousand tons of almonds are produced each year
The amount of waste created from almond production is not currently available
MOROCCO
An estimated 150-160 thousand tons of almonds are produced each year
It is estimated that 102-120 thousand tons of almond waste is produced each year
AUSTRALIA
.jpg)
MEXICO
In 2024 over 2 million tons of agave were produced
It is estimated that at least 5 million tons of agave waste is produced each year
.jpg)
An estimated 1.65 million tons of oil palm is produced each year
An estimated 2.76 million tons of oil palm waste is produced each year
COLOMBIA
An estimated 41-46 million tons of oil palm are produced each year
An estimated 88.55 million tons of oil palm waste was produced in the 20245/2025 market year
INDONESIA
An estimated 18.98 million tons of oil palm are produced each year
An estimated 566 million tons of oil palm waste is produced each year
MALAYSIA
.jpg)
An estimated 792 thousand tons of coffee beans are produced each year
An estimated 6-9 million tons of coffee waste is produced each year
COLOMBIA
BRAZIL
An estimated 3.7 million tons of coffee is produced each year
It is estimated that over 3 million tons of coffee bean waste is produced each year
An estimated 1.7-1.8 million tons of coffee beans are produced each year
An estimated range of 4.5 million tons of coffee waste is produced each year
VIETNAM
.jpg)
BRAZIL
An estimated 2.4 million tons of coconut are produced each year
It is estimated that over 2 million tons of coconut waste is produced each year
.jpg)
An estimated 17.2 million tons of coconut are produced each year
It is estimated that 32 million tons of coconut waste is produced each year
INDONESIA
An estimated 14.9 million tons of coconut are produced each year
An estimated 5 million tons of coconut waste is produced each year
PHILIPPINES
INDIA
An estimated 13.3 million tons of coconut are produced each year
It is estimated that at leas 5.32 million tons of coconut waste is produced each year
.jpg)
BRAZIL
An estimated 37-44 million tons of sugar are produced each year
An estimated 415 million tons of sugar waste is produced each year
An estimated 530-610 thousand tons of sugar is produced each year
An estimated 1.5-2 million tons of waste is produced from sugar production each year
KENYA
An estimated 4 million tons of sugar is produced each year
It is estimated that over 10 million tons of waste is produced from sugar production each year
AUSTRALIA
THAILAND
An estimated 10 million tons of sugar is produced each year
An estimated 16.7-20 million tons of waste is created from sugar production each year
.jpg)
An estimated 1.6 million tons of onion will be produced by the end of 2025
An estimated 240 thousand tons of waste is produced from onion production each year
NIGER
An estimated 2.1 million tons of onion will be produced by the end of 2025
An estimated 168-367 thousand tons of onion waste is produced each year
IRAN
An estimated 1.2 million tons of onion will be produced by the end of 2025
The amount of waste created from onion production is not currently available
JAPAN
An estimated 1.6 million tons of onion will be produced by the end of 2025
The amount of waste created from onion production is not currently available
SUDAN
.jpg)
An estimated 4 million tons of apple is produced each year
An estimated 850 thousand tons of apple waste is produced each year
POLAND
An estimated 42.51 million tons of apple is produced each year
It is estimated that over 1 million tons of apple waste is produced each year
CHINA
An estimated 3.84 million tons of apple is produced each year
An estimated 850 thousand-1.76 million tons of apple waste is produced each year
TURKEY
An estimated 4.72 million tons of apple is produced each year
The amount of waste created from apple production is not currently available
UNITED STATES
.jpg)
An estimated 8 million tons of banana is produced each year
An estimated 5.6-11.2 million tons of banana waste is produced each year
NIGERIA
An estimated 33 million tons of banana is produced each year
The amount of waste created from banana production is not currently available
INDIA
An estimated 11.7 million tons of banana is produced each year
An estimated 48.6 million tons of banana waste is produced each year
CHINA
An estimated 8.7 million tons of banana is produced each year
The amount of waste created from banana production is not currently available
INDONESIA
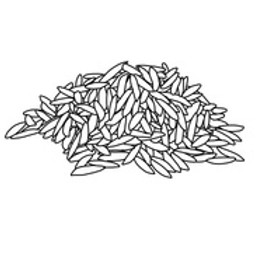
.jpg)
MADAGASCAR
An estimated 4.6-5.1 million tons of rice is produced each year
It is estimated that at least 1 million tons of waste is created from rice production each year
An estimated 146 million tons of rice is produced each year
It is estimated that over 200 million tons of rice waste is produced each year
CHINA
INDIA
An estimated 123-150 million tons of rice is produced each year
An estimated 126 million tons of rice waste is produced each year
.jpg)
SOUTH AFRICA
An estimated 897 thousand tons of eucalyptus is produced each year
The amount of waste created from eucalyptus production is currently unknown
AUSTRALIA
An estimated 6-7 million tons of eucalyptus firewood is produced each year
The amount of waste created from eucalyptus production is not currently available
PORTUGAL
An estimated 1.3 million tons of eucalyptus is produced each year
An estimated 0.8-1.2 million tons of dry biomass eucalyptus waste is produced each year
.jpg)
ARGENTINA
An estimated 3.5 million tons of sunflower seed is produced each year
An estimated 1.75-2 million tons of sunflower waste is produced each year
An estimated 15.8 million tons of sunflower seed is produced each year
The amount of waste created from sunflower production is currently unkown.
RUSSIA
HUNGARY
An estimated 1.8-2 million tons of sunflower seed is produced each year
An estimated 3.5-7.8million tons of sunflower waste is produced each year
TANZANIA
An estimated 350 thousand tons of sunflower seed is produced each year
The amount of waste created from sunflower production is not currently available
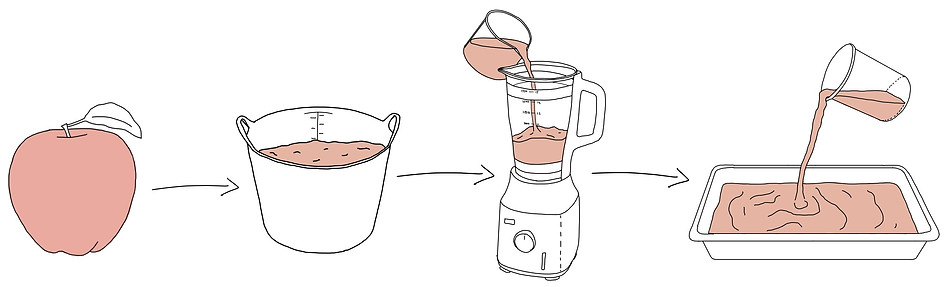
In Your Grocery Store
Many of these byproducts come from the items sold in your grocery store. Click on the grocery items to explore how their respective byproducts can be transformed into experimental materials.

New York State Byproducts
Lets now zoom into our area of the world. New York State has eleven different regions, each of which produce their own amounts of of agricultural product. From the examples on the world map above, some of the most prevalent agricultural crops in New York include apples, corn, potato, wheat, onion, and sunflower. Hover over each agricultural region to see what major agricultural crop is grown there. Pay attention to the agricultural density as well. This tells us where there is the most agricultural production.


Hover to find the region's popular products
Percentage of Farmland in County
.png)
.png)
.png)


.png)


Real Built Byproducts
The processes of using agricultural byproducts to create built spaces is not a new concept. There have been hundreds of studies done with many different byproducts around the world. Here are just a few examples of how agricultural "waste" is being used to create building materials, furniture, and interior decor to help enhance lived spaces in a sustainable way.

"Adam Sheet"
New bio textile founded by Shotaro Oshima and his team made from discarded apple pomace

Blue Dot Farm
Straw and sheep's wool combined with plywood to create an easy-to-build wall system

Terra Bio Furniture
Tel Aviv based designer Adital Ela has created furniture using compacted earth, construction debris, and agricultural waste

Sugarcrete
The University of East London and Britain's Grimshaw Architects created a modular reusable floor slab out of sugarcane bagasse and mineral-based binders

CornBoard
Corn Board Manufacturing has a patent on the creation of composite boards made from corn waste that can be used as a building or furniture material

OTTAN Furniture
OTTAN Studio creates furniture and interior decor from fruit peels, nut shells, leaves, grass, and more.

Agave Bricks
818 Tequila company is using leftover agave byproduct to make bricks

Banana Fabric
Uganda-based company TEXFAD is making fabric out of discarded banana leaves and stems

Coffee Plaster
Studies done in Moroccan and French labs shows that adding coffee grounds to plaster improves its thermal properties

ACRE
The manufacturing company Modern Mill has patented ACRE, a sustainable alternate to wood made from rice hulls